The Way We See It
Using visualization for analysis, simulation, and training in self-driving AI systems
At Drive.ai, we’re using deep learning to build the safest, smartest self-driving vehicles possible. We want to solve the transportation challenges facing communities today. To do this, we plan to deploy our technology with a growing fleet of self-driving vehicles in a variety of locations and conditions. Previously, we shared key operational learnings from this fleet and announced our first deployment in Frisco, Texas.
Our self-driving system generates incredible amounts of compelling data, which our engineering team uses to iterate and improve our system’s safety, performance, and capabilities. Visualization is one of the most important tools to understand data, and we invest in it heavily.
Here’s an inside look at some of our primary visualizations and how we use them in on-board displays, off-board analysis, annotation tools, and simulation.
On-board displays
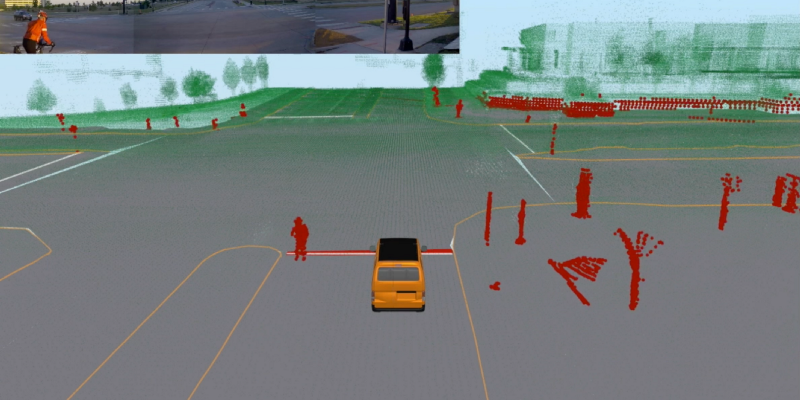
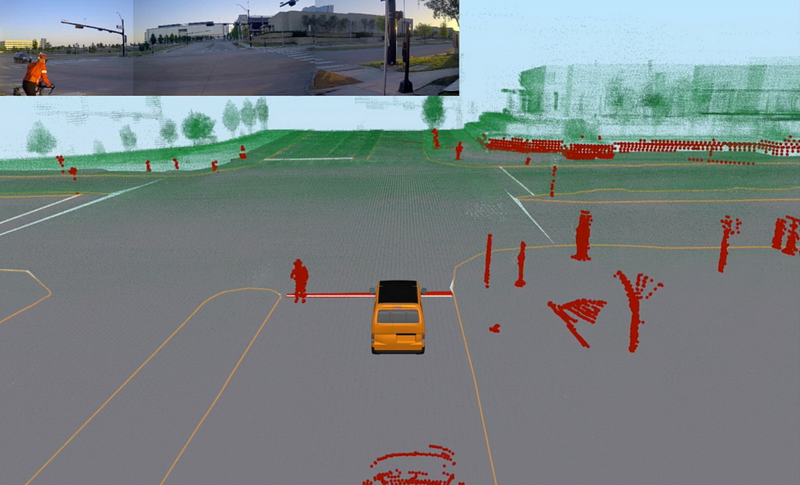
On-board visualization is important for passengers inside the car. These displays allow passengers to understand exactly what the car is seeing, thinking, and planning to do as it drives. Displaying a simple visualization helps passengers feel more comfortable.
On-board displays show sensor data in a way that is intuitive and easy to understand. We create a full-surround 3D picture of the environment using “point clouds” derived from lidar sensors and combined with rich video data about the scene, which is collected from full-surround cameras. By combining both sensors, along with others elements such as radar, GPS, and a device called an inertial measurement unit (IMU), the displays show how the car understands what is happening in the environment around it.
Off-board analysis
Inspecting the quality of our HD maps is one form of off-board analysis
While the on-board system comprises the AI doing the driving, there are even more components in our off-board system. Our AI system is composed of a complete robotics stack, including: sensor calibration, mapping, localization and state estimation, perception, motion planning, and controls.
Each component depends on many other components and the real-time data produced by them. These components need to be developed, trained, and thoroughly tested. We use 3D visualization tools to replay data collected from human-driven and AI-driven rides. Similar to using pause, rewind, and fast forward to skip ahead in a video, we play and review our driving data logs meticulously. Time synchronization is key when combining multiple lidar and camera streams, as well as localization reports, object detections, and motion plans. We draw all of the data in a coherent 3D world, and align it with our HD maps (like street maps but in 3D) and road networks. These visualizations provide us the tools we need to ask and answer questions about the data.
Annotating massive datasets
Annotation is the process of labeling all of the data collected on the road in order for our systems to understand what they are seeing, and ensure they learn how to discern and differentiate stimuli. Annotation is a critical part of the self-driving cycle. For every one hour driven, it takes approximately 800 human hours to label it. But we want to annotate much faster than this — and at 100% accuracy.
To accomplish this, we use deep-learning-enhanced automation, enabling us to annotate data in a faster, more reliable way. We begin with a team of human annotators who do the first iteration — identifying objects like trees, cars, pedestrians, and bicyclists seen on the roads by our vehicles and sensor kits — and couple this with various engineering optimizations. We prioritize UI and workflow efficiency for our annotation team, building in features such as easily “scrubbing” backwards or forwards through time by dragging the cursor, and automatic interpolation of data between frames. Efficiencies such as these improve the rate and accuracy of the data annotation process.
As we continue to expand and train our vehicles on new routes, scaling the annotation process with absolute precision is of utmost importance. By using human input to corroborate our AI system’s decisions, we are iteratively improving the deep-learning system, which in turn, starts to learn and operate at higher speeds and with larger data sets.
The spectrum of simulation
Simulation is a critical part of validating the safety and performance of our self-driving system. We use our simulator as an interactive tool to continuously test and evaluate our systems. The simulator provides a virtual environment to stand in for the real world. Engineers interact with the simulator through a user interface with a 3D visualization of the world. They can modify the simulated “world” however they want — like switching the state of traffic lights, positioning other vehicles on the roads, or creating algorithmically-controlled dynamic agents like pedestrians or cars — and watch how our self-driving AI responds.
We’ve built massive libraries of scenarios automatically from the driving data we’ve collected, as well as from modifying different parameters carefully in code to cover a broad distribution of events. Through these methods, we can evaluate our self-driving system on both common and edge case scenarios. Visualization tools enable our engineers to glean the most information from the huge volume of simulation results. We’ll be sharing more details about our approach to simulation in a future post.
From the shoulders of giants
Open-source software has greatly impacted the software industry, especially in robotics and self-driving vehicles. An example of open-source success is the Robot Operating System (ROS). We’d like to acknowledge those we’ve built on top of; like many self-driving companies, our company’s roots were in ROS-based software development. We have since moved to using a new middleware system of our own design — which we have named Drive.ai pub-sub, or DPS — but still leverage open-source elsewhere. While our middleware is not yet ready to be open-sourced, we’ve designed it with the possibility of this in mind.
In the case of visualization, we build on Director, a robotics visualization and interface framework, which is based on the leading open-source libraries, VTK (The Visualization Toolkit) and Qt (user interface software). Director is a robotics visualization and interface framework developed during the 2012–2015 DARPA Robotics Challenge (DRC) by the MIT team. Director was used to develop and operate the highly-autonomous humanoid robot Atlas (built by Boston Dynamics).
Director’s 3D graphics and user interface system are designed to meet the demands of robotics R&D. Director works together with robotics middleware systems to visualize high-frequency sensor streams and combine them with large-scale data like pointcloud maps and panoramic imagery.
The way we see it
At Drive.ai, we use state-of-the art visualization techniques to show accurate, high-resolution data to both passengers in our vehicles and our team designing the systems on the back-end. Whether it’s a simplified passenger visual displayed on-board or a data-rich annotation set, the visualizations we use are a crucial part of our engineering R&D cycle.
In sharing more about how we use visualization, we hope to have provided a deeper understanding of the variety of use cases and contexts in which we use these tools. We hope to have demonstrated the power and impact of these approaches as we develop our self-driving systems to be the best they can be.
To keep up with future behind-the-scenes posts about Drive.ai, you can subscribe to our Medium page, YouTube channel, or follow us on Twitter at @driveai_.
Pat Marion is Drive.ai’s Head of Simulation and the author of Director, a robotics interface and visualization framework. Kah Seng Tay is Drive.ai’s VP of Engineering overseeing the R&D and software team.
Interested in data visualization, AI/ML and simulation challenges at Drive.ai? Apply to join us now at https://www.drive.ai/careers.